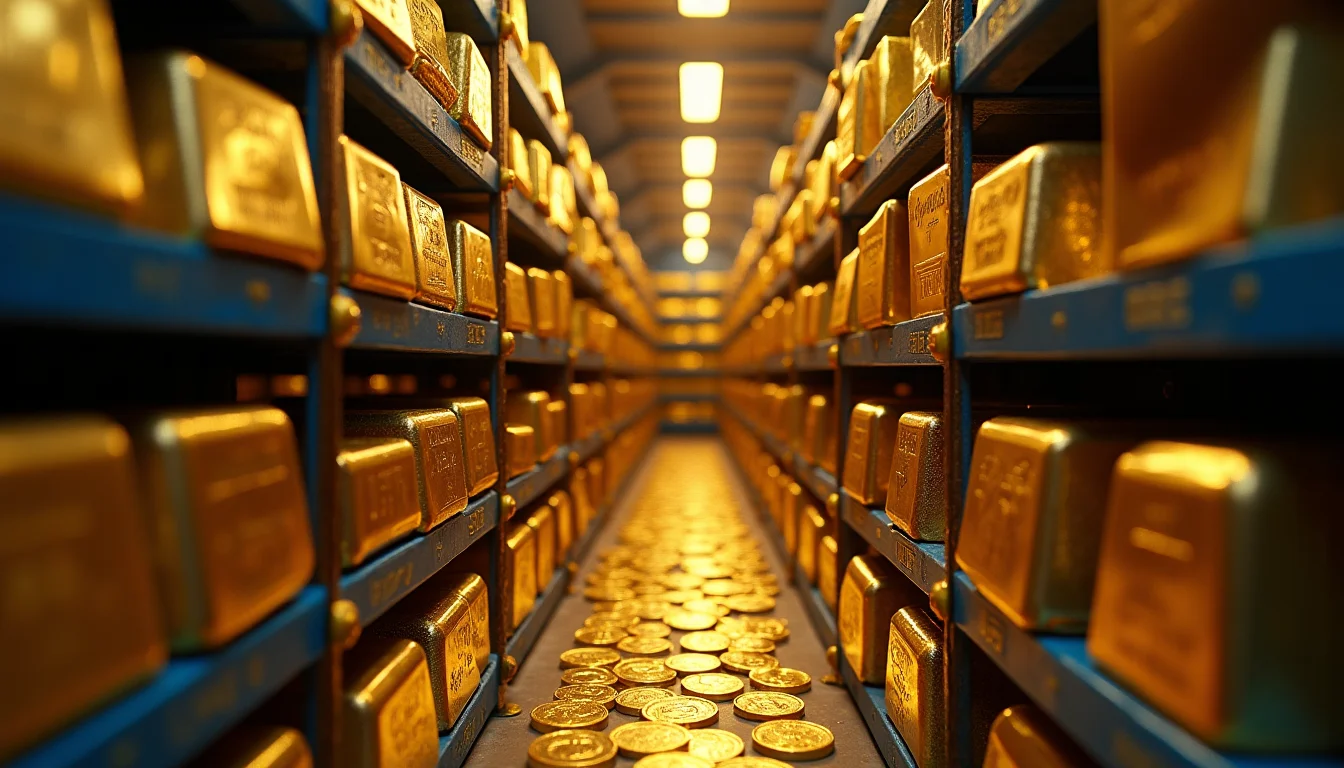
Gold is trading at $4,399 per ounce — down just 0.01% on the session but sitting at a level that would have seemed extraordinary even 18 months ago — while SMH Business reports the metal's price now functions as a direct barometer of political and policy risk emanating from Washington. Silver trades at $66.59, down 0.24%, while platinum has edged up 0.70% to $1,839 — a divergence that tells its own story about where institutional capital is concentrating.
What the Gold Price Is Actually Pricing In
At $4,399, gold is not simply reflecting inflation hedging or currency debasement in the conventional sense. According to SMH Business, the metal's sustained elevation encodes investor anxiety about the durability of US institutional arrangements, trade policy direction, and the reliability of dollar-denominated assets as a store of value. The Fed Funds Rate sits at 3.63% and US 10-year Treasury yields are at 4.77% — both positive in real terms given US inflation of 2.6% — yet gold continues to hold near its highs. That combination is historically unusual. When real yields are positive, gold typically faces headwinds because opportunity cost rises. The fact that gold is not retreating meaningfully suggests the risk premium embedded in the price is structural, not cyclical.
The Shiller CAPE at 41.4 reinforces this reading. Equity valuations remain stretched, and investors seeking assets uncorrelated with overvalued stock markets are not finding bonds sufficient on their own at current yield levels. Gold, at this price, is absorbing demand from investors who distrust both the equity risk premium and the political context surrounding US fiscal policy. The AUD/USD at 0.7219 means Australian-dollar gold prices have also stayed elevated at A$6,095 per ounce — relevant for the economics of ASX-listed gold producers whose revenues are USD-denominated but whose costs are largely in Australian dollars.
Mining Sector Performance Under a High-Gold-Price Regime
The ASX 200 fell 0.94% to 8,921 in the most recent session, with SMH Business noting that rising oil prices — WTI crude is up 2.56% to $93.82 per barrel — are weighing on sentiment broadly. For the mining sector specifically, higher oil prices represent a direct cost escalation. Diesel-intensive open-cut gold and copper operations face margin compression when energy costs rise sharply, even if the commodity price they are producing remains high. This cost-versus-revenue dynamic is central to how miners perform during periods like the present one.
Copper is up 1.96% to $6.81 per pound, which is a constructive signal for diversified miners and polymetallic explorers. Projects with copper credits alongside gold or silver become materially more attractive when both metals move in the same direction. Exploration companies with copper-gold or copper-silver resource profiles benefit from the optionality that higher prices create for project economics — lower cut-off grades become viable, smaller deposits become economically mineable, and the capital market appetite for funding exploration rounds improves. The VIX at 15.62 — up 2.09% — reflects rising equity market uncertainty, but historically a moderate VIX in the mid-teens is not hostile to resource equities when underlying commodity prices are firm.
For investors tracking mining sector performance through the lens of commodity price signals, the current environment requires distinguishing between producers and explorers. Producers with locked-in hedging programs may not fully capture the $4,399 gold price, while unhedged producers and late-stage developers are the primary beneficiaries. Junior explorers, particularly those on the ASX, benefit from improved sentiment and from the willingness of institutional investors to fund exploration when the price of the target commodity is high enough to justify the geological risk. For a deeper understanding of how gold fits within a broader precious metals allocation, the Precious Metals Investing guide provides a useful framework for comparing gold, silver, and platinum exposure.
Oil's Rise Complicates the Mining Cost Picture
WTI crude at $93.82 per barrel is not a number the mining sector can ignore. Energy is typically the largest single operating cost for open-pit mines, often representing 20% to 35% of all-in sustaining costs depending on haulage distances and processing intensity. At current gold prices, the margin for most producers remains healthy — but the direction of travel matters. A further move in oil toward $100 per barrel would start compressing margins at high-cost operations and could defer development decisions at projects where the feasibility economics are marginal.
The relationship between oil prices and mining equities is one reason why the broader market context — particularly the ASX 200's 0.94% decline — cannot be separated from sector-specific analysis. Rising energy input costs feed through to earnings estimates, and mining equities are sensitive to earnings revisions in ways that the underlying metal price alone does not capture. Investors who track this relationship through the lens of historical commodity cycles can find useful context at Bubblepedia which documents how commodity price spikes have historically interacted with producer cost structures during periods of broad market stress.
Background: Gold as a Political Signal and Safe Haven
Gold's role as a signal of political risk is well-documented across multiple historical episodes. The metal rose sharply during the Nixon shock of 1971, again during the inflationary crises of the late 1970s, and during the European sovereign debt crisis of 2011-2012. In each case, gold's price reflected not just inflation expectations but doubts about the reliability of institutional frameworks — monetary, fiscal, or political. The current environment, as described by SMH Business, maps onto this historical pattern: elevated gold prices when real yields are positive is a sign that something beyond conventional hedging demand is at work.
For investors weighing gold against other asset classes — including digital assets such as Bitcoin, which is currently trading at $78,670, down 0.99% — the contrast is instructive. Bitcoin has fallen nearly 1% while gold is essentially flat, suggesting that in this specific risk-off moment, capital is not treating the two as equivalent stores of value. The Gold vs Bitcoin guide examines this distinction in detail. For those specifically interested in gold's role as a crisis hedge, the Gold as a Safe Haven Asset guide provides historical return data across multiple stress periods. The Precious Metals Hub offers current pricing and sector analysis.
Gold at $4,399 while US 10-year real yields remain positive is a configuration last seen during periods of acute institutional stress — it signals that the market is pricing something beyond conventional inflation hedging into the metal's value.
What Forward-Looking Investors Should Watch
Three variables will determine whether the current gold price level is sustained or retreats in coming months. First, the direction of US trade and fiscal policy — the primary driver of the political risk premium identified by SMH Business. Second, the trajectory of oil prices: WTI at $93.82 and rising adds direct cost pressure to mining operations globally, which affects producer earnings even when gold prices are high. Third, the AUD/USD rate: at 0.7219, the currency is providing a meaningful buffer for Australian gold producers, translating USD gold prices into elevated AUD revenue. Any significant AUD appreciation would compress that buffer. Investors positioned in ASX gold equities or global gold ETFs should monitor these three inputs together rather than treating the spot gold price as the sole relevant variable — and should revisit gold investing fundamentals before sizing positions in a market where the risk premium itself is the primary analytical challenge.