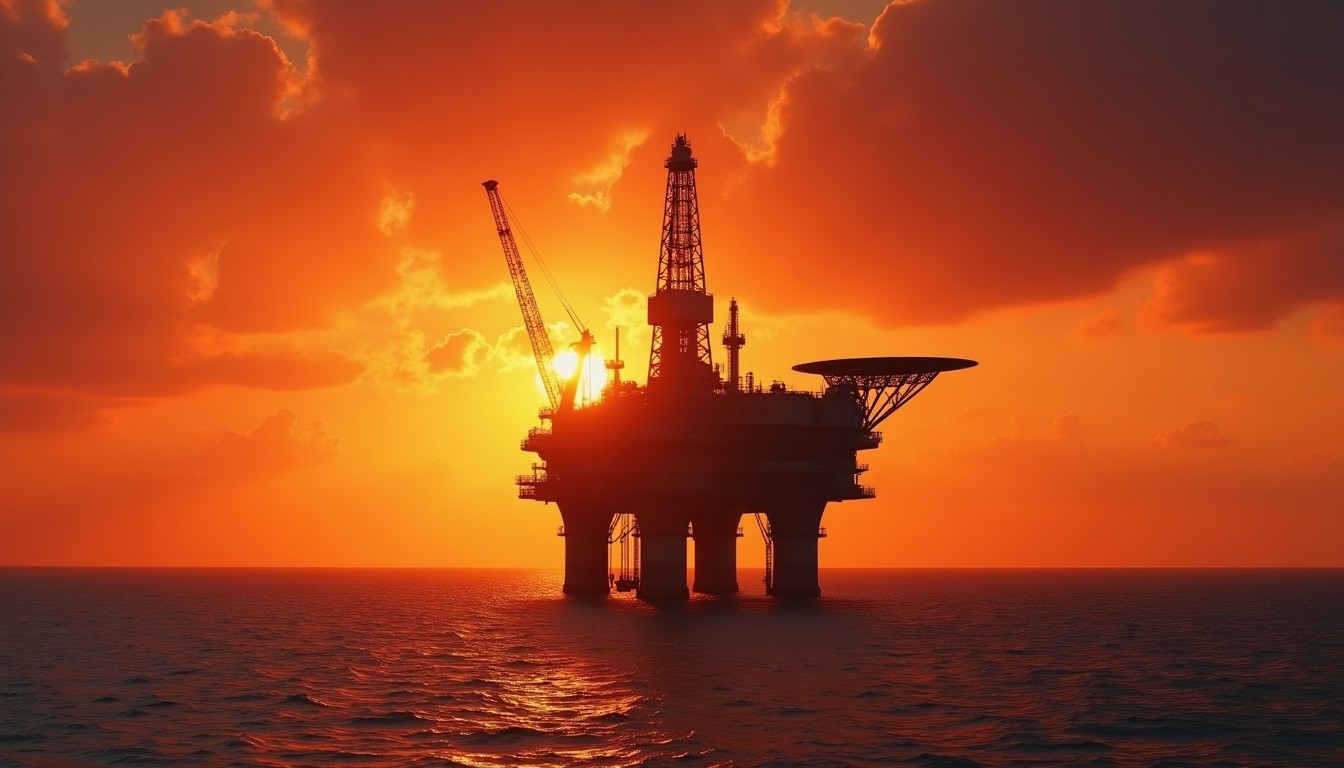
The Oil Market Explained — How Crude Oil Prices Shape the Global Economy
This comprehensive guide explores how crude oil markets influence global economics, covering major benchmarks, OPEC dynamics, US shale impact, petrodollar systems, energy transitions, and investment implications for Australian portfolios.
Key Takeaways
- →Brent crude and WTI benchmarks directly impact ASX energy stocks and broader market sentiment through correlation effects.
- →OPEC production decisions create oil price volatility affecting Australian energy sector investments and inflation expectations domestically.
- →US shale production growth reduces global oil prices, benefiting Australian consumers but pressuring local energy company margins.
- →Petrodollar recycling strengthens USD during oil price rises, creating headwinds for AUD-denominated commodity export revenues.
- →Energy transition policies drive long-term oil demand decline, making renewable energy ETFs attractive portfolio diversification plays.
Daily Production
World produces approximately 100 million barrels of oil per day as of 2024
OPEC Founded
September 1960 in Baghdad — Venezuela, Saudi Arabia, Iraq, Iran, Kuwait as founding members
1973 Oil Shock
Arab oil embargo October 1973 — oil price quadrupled from $3 to $12 per barrel in weeks
Brent vs WTI
Two main global benchmarks — Brent (North Sea, global reference) and WTI (West Texas Intermediate, US reference)
Petrodollar System
Since 1974 Nixon-Kissinger deal, all OPEC oil priced in USD — creating permanent global dollar demand
Peak Oil Debate
US shale revolution 2008–2015 disproved conventional peak oil theory — US became world's largest producer by 2018
No commodity has shaped the modern global economy more profoundly than crude oil. Since its emergence as the world's primary energy source in the early twentieth century, petroleum has driven industrial growth, determined geopolitical power structures, and created the wealth of nations. Today's integrated global economy remains fundamentally dependent on this finite resource, with its price movements capable of triggering recessions, inflating currencies, and reshaping international relations.
The modern oil market emerged from the breakup of Standard Oil in 1911, but its current structure dates to the post-World War II era. The establishment of major oil companies—initially dominated by the "Seven Sisters" consortium—created an integrated global supply chain from wellhead to petrol station. This system has evolved through multiple phases: the era of corporate control (1945-1973), the OPEC revolution (1973-1985), market liberalisation (1985-2008), and the current age of shale disruption and energy transition.
Understanding oil markets requires grasping both their physical fundamentals—geology, refining capacity, transportation infrastructure—and their financial complexity. Oil trades simultaneously as a physical commodity, a financial instrument, and a geopolitical weapon. Its price discovery mechanism involves spot markets, futures contracts, and long-term supply agreements, all influenced by everything from weekly inventory reports to Middle Eastern conflicts.
Why Oil is the World's Most Important Commodity
Oil's centrality to the modern economy stems from its unique combination of energy density, versatility, and entrenched infrastructure. Petroleum contains approximately 38 megajoules per litre—roughly 100 times the energy density of lithium-ion batteries. This physical property made it ideal for powering the twentieth century's transportation revolution and remains the primary reason why oil derivatives fuel 97% of global transport energy today.
Beyond transport, oil permeates every sector of the modern economy. Approximately 45% of each barrel becomes gasoline, with the remainder refined into diesel, jet fuel, heating oil, and petrochemical feedstocks. The petrochemical industry transforms crude oil into plastics, synthetic fibres, fertilisers, pharmaceuticals, and thousands of other products. Modern agriculture depends heavily on oil-derived inputs: synthetic fertilisers, pesticides, and diesel fuel for machinery.
The scale of global oil consumption reflects this dependence. Current consumption exceeds 100 million barrels daily—equivalent to 16 billion litres or enough to fill 6,400 Olympic swimming pools every day. This represents the largest commodity flow in human history, with an annual market value exceeding $4 trillion at current prices.
Economic research has consistently demonstrated oil's correlation with global GDP growth. The International Energy Agency estimates that every 10% increase in oil prices reduces global GDP growth by 0.2-0.3 percentage points in the following year. Conversely, oil price collapses can stimulate economic growth, particularly in oil-importing nations.
"Every major recession since World War II has been preceded by a sharp oil price increase. The 1973 Arab oil embargo, the 1979 Iranian Revolution, Iraq's invasion of Kuwait in 1990, and the oil price spike preceding the 2008 financial crisis all demonstrate oil's power to trigger economic downturns through demand destruction and inflationary pressure."
This relationship persists because oil price shocks affect both supply and demand sides of the economy. Higher oil prices increase production costs across industries, reduce consumer spending power, and create inflationary pressures that force central banks to raise interest rates. The resulting economic slowdown typically reduces oil demand, eventually moderating prices—but often only after significant economic damage.
How Oil is Priced
Oil pricing operates through a complex system of benchmark crudes, futures markets, and physical trading hubs. Two benchmarks dominate global pricing: Brent crude from the North Sea and West Texas Intermediate from the United States. Brent serves as the international benchmark, pricing approximately 70% of global oil trades, while WTI primarily reflects North American market conditions.
These benchmarks trade on major exchanges—Brent on London's Intercontinental Exchange (ICE) and WTI on the New York Mercantile Exchange (NYMEX). Futures contracts allow market participants to buy or sell oil for delivery months or years in advance, providing price discovery and risk management tools. The front-month contract (nearest expiry) typically receives the most attention as it reflects immediate supply and demand conditions.
Supply Factors: OPEC production decisions, US shale drilling activity, geopolitical disruptions, refinery maintenance schedules, strategic petroleum reserve releases
Demand Factors: Global economic growth, seasonal driving patterns, industrial activity, Chinese imports, airline passenger miles
Financial Factors: US dollar strength, interest rates, speculative positioning, inventory levels, ETF flows
Weekly data releases significantly impact oil prices. The US Energy Information Administration's Wednesday inventory report shows changes in crude oil, gasoline, and distillate stocks, providing insights into supply-demand balance. Unexpected inventory builds typically pressure prices lower, while draws support higher prices.
OPEC's monthly meeting decisions generate substantial market volatility. When member countries agree to cut production quotas, prices typically rally on reduced supply expectations. However, compliance with these cuts varies significantly among members, with Saudi Arabia typically showing the highest adherence while countries like Iraq and Nigeria often exceed their quotas.
Currency movements also affect oil prices since petroleum trades globally in US dollars. When the dollar strengthens against other currencies, oil becomes more expensive for non-dollar buyers, typically reducing demand and pressuring prices lower. Conversely, dollar weakness can stimulate oil demand and support higher prices.
OPEC and the Politics of Oil
The Organisation of the Petroleum Exporting Countries fundamentally altered global energy markets when five founding members—Venezuela, Saudi Arabia, Iraq, Iran, and Kuwait—established the cartel in Baghdad in September 1960. Initially formed to counter the pricing power of Western oil companies, OPEC gained prominence during the 1970s oil crises that transformed it into one of the world's most influential economic institutions.
OPEC's founding responded to unilateral price cuts imposed by the Seven Sisters—a consortium of Western oil companies including Exxon, Shell, BP, Chevron, Texaco, Mobil, and Gulf Oil. These companies controlled global oil production, refining, and distribution through long-term concession agreements with producing countries. The cartel's initial goal was coordinating policies to secure fair and stable prices for petroleum exports.
The organisation's transformation into a geopolitical force began with the October 1973 Arab-Israeli War. Arab OPEC members, led by Saudi Arabia, imposed an oil embargo against countries supporting Israel, including the United States and Netherlands. Oil prices quadrupled from approximately $3 to $12 per barrel within months, demonstrating petroleum's potential as an economic weapon and ending the era of cheap energy.
The 1979 Iranian Revolution provided OPEC's second major demonstration of market power. The overthrow of Shah Mohammad Reza Pahlavi disrupted Iranian oil exports, removing approximately 5.6 million barrels per day from global markets. Other OPEC members failed to fully compensate for this loss, driving oil prices from $15 to over $35 per barrel and contributing to the early 1980s recession.
| Period | OPEC Market Share | Key Events |
|---|---|---|
| 1960-1970 | 45% | Formation, price coordination against Seven Sisters |
| 1973-1985 | 50%+ | Arab embargo, Iranian Revolution, peak influence |
| 1985-2008 | 35-40% | Non-OPEC growth, Saudi market share strategy |
| 2008-Present | 40% | OPEC+ formation, shale competition |
OPEC's influence declined during the 1980s and 1990s as high oil prices stimulated non-OPEC production growth, particularly in the North Sea, Alaska, and Latin America. The organisation's market share fell below 40% as members struggled to maintain production discipline amid falling prices and rising debt burdens.
The 2016 formation of OPEC+ marked the cartel's adaptation to changed market conditions. By including Russia and other major non-OPEC producers, the expanded alliance controls approximately 55% of global oil production. This cooperation proved crucial during the 2020 COVID-19 pandemic when OPEC+ implemented the largest production cuts in history—nearly 10 million barrels per day—to support collapsing prices.
Saudi Arabia remains OPEC's swing producer, possessing both the largest spare production capacity and the political will to adjust output for market management. The kingdom's ability to bring 2-3 million barrels per day online within months provides OPEC with its primary tool for price support during supply disruptions or demand crashes.
The US Shale Revolution
The American shale revolution represents the most significant transformation in global oil markets since OPEC's formation. Beginning in earnest around 2008, the combination of horizontal drilling and hydraulic fracturing (fracking) technologies unlocked vast oil reserves previously considered uneconomic, fundamentally altering global supply dynamics and geopolitical relationships.
The Permian Basin in Texas emerged as the epicentre of this transformation. Advanced drilling techniques allowed producers to extract oil from tight rock formations that conventional methods could not access. US crude oil production increased from approximately 5 million barrels per day in 2008 to over 13 million barrels per day by 2019, making America the world's largest oil producer for the first time since the 1970s.
This production surge challenged OPEC's market dominance and pricing power. Traditional oil economics assumed that marginal supply came from OPEC countries with large, low-cost reserves. Shale production introduced a new dynamic: thousands of independent operators making drilling decisions based on short-term price signals rather than long-term geopolitical strategies.
"The shale revolution destroyed OPEC's monopoly on marginal oil supply. Instead of a small group of ministers meeting in Vienna to decide global production levels, oil markets now respond to the collective drilling decisions of hundreds of Texas and North Dakota operators. This has made oil prices more responsive to market forces but also more volatile."
OPEC initially underestimated shale's resilience. In November 2014, Saudi Arabia led a strategy to maintain production levels despite falling prices, expecting that sub-$60 oil would bankrupt high-cost shale producers. Oil prices collapsed from $115 per barrel in mid-2014 to $27 in early 2016, but the anticipated shale collapse never materialised.
Instead, shale operators demonstrated remarkable adaptability. Companies reduced drilling costs by 40-50% through technological improvements, operational efficiency, and service cost reductions. The breakeven price for many Permian Basin wells fell from over $100 per barrel to below $50. Enhanced recovery techniques increased production per well, while longer lateral drilling reduced per-unit costs.
The industry's financial structure also evolved. Early shale development relied heavily on debt financing and private equity, leading to cash flow negative operations focused on production growth rather than profitability. After the 2014-2016 downturn, investors demanded capital discipline and positive cash flow, forcing operators to focus on their highest-quality acreage and most efficient operations.
Shale's impact extended beyond production volumes to market dynamics. Traditional oil development required multi-year lead times and billion-dollar investments, making supply relatively inelastic in the short term. Shale wells can be drilled and completed within months, allowing producers to respond quickly to price signals. This has made oil markets more sensitive to price changes but also more volatile as supply adjustments occur faster.
The geopolitical implications proved equally significant. US oil import dependence, which peaked at over 60% in 2005, fell to below 20% by 2019. This energy independence reduced American vulnerability to Middle Eastern supply disruptions and provided greater foreign policy flexibility. For analysis of oil price bubbles and commodity market manias, see Bubblepedia →
The Petrodollar System and Oil's Role in Dollar Hegemony
The petrodollar system represents one of the most consequential monetary arrangements in modern history, cementing the US dollar's role as the global reserve currency while creating structural demand for American government debt. This system emerged from negotiations between Henry Kissinger and Saudi officials following the 1973 oil crisis, establishing a framework that has underpinned both oil markets and international finance for five decades.
The 1974 agreement between the United States and Saudi Arabia created a mutually beneficial arrangement. Saudi Arabia agreed to price its oil exports exclusively in US dollars and invest surplus revenues in US Treasury securities, while America provided military protection and advanced weapons systems to the kingdom. Other OPEC members gradually adopted similar arrangements, creating a system where global oil purchases required US dollars.
This "petrodollar recycling" generated enormous structural demand for both US dollars and dollar-denominated assets. Oil-importing countries needed dollars to purchase petroleum, while oil-exporting countries accumulated dollar surpluses that typically flowed into US financial markets. The Bank for International Settlements estimates that OPEC countries have invested over $4 trillion in US assets since 1974, providing crucial financing for American government deficits and trade imbalances.
The petrodollar system reinforced the dollar's international monetary dominance established at Bretton Woods in 1944. Even after President Nixon ended dollar convertibility to gold in 1971, oil pricing in dollars maintained international demand for the currency. This arrangement allowed the United States to run persistent current account deficits without experiencing currency crises that would affect other nations in similar positions.
Recent developments threaten this arrangement's longevity. China, the world's largest oil importer, has launched yuan-denominated oil futures and negotiated bilateral trade agreements that bypass dollar payment systems. Russia, facing Western sanctions, has increasingly priced its energy exports in rubles or yuan when trading with non-Western partners.
Most significantly, Saudi Arabia has discussed accepting yuan for Chinese oil purchases, potentially ending the kingdom's exclusive dollar pricing commitment. These discussions gained momentum following strained US-Saudi relations and China's emergence as Saudi Arabia's largest trading partner. While no formal agreement has materialised, the mere possibility signals potential cracks in the petrodollar system's foundation.
The implications extend far beyond oil markets. A significant shift away from dollar-denominated oil pricing could reduce global dollar demand, potentially triggering currency devaluation and forcing the Federal Reserve to adjust monetary policy to maintain the dollar's international role. For a deeper exploration of these monetary system dynamics, readers can examine our History of Money Part 2 analysis.
Oil and the Energy Transition
The global energy transition presents both the greatest long-term challenge and opportunity for oil markets in the commodity's history. While renewable energy technologies advance rapidly and electric vehicle adoption accelerates, oil demand continues growing in developing economies, creating complex dynamics that will determine petroleum's future role in the global energy system.
The International Energy Agency's Net Zero by 2050 scenario requires global oil demand to peak before 2025 and decline by 75% by 2050. This projection assumes aggressive decarbonisation policies, massive renewable energy deployment, and widespread electrification of transport. However, the IEA's more conservative scenarios, which assume slower policy implementation, show oil demand continuing to grow until the mid-2030s before gradual decline begins.
Developing world motorisation represents a significant wildcard in these projections. Countries like India, Indonesia, and Nigeria have vehicle ownership rates below 50 per 1,000 people, compared to over 800 in the United States. As these economies develop, transportation fuel demand could increase substantially, potentially offsetting demand reductions in developed countries for decades.
Oil companies have responded with varied strategies. European majors like Shell and BP have announced significant investments in renewable energy, hydrogen, and carbon capture technologies, positioning themselves as "integrated energy companies" rather than pure oil producers. American companies like ExxonMobil and Chevron have focused on reducing emissions from existing operations while maintaining core petroleum businesses.
"The energy transition will likely unfold over decades rather than years, with natural gas serving as a crucial bridge fuel. Gas-fired power generation produces roughly half the carbon emissions of coal while providing the flexibility needed to complement intermittent renewable sources. This transition fuel role could sustain hydrocarbon demand even as renewables expand rapidly."
Investment implications vary significantly by timeframe and geography. Short-term oil market fundamentals remain driven by traditional supply and demand factors, with underinvestment in new production potentially creating supply shortages in the mid-2020s. Long-term projections suggest oil prices may need to fall substantially to maintain competitiveness against electric alternatives, potentially stranding high-cost production assets.
The transition also creates opportunities for resource-rich countries to pivot toward renewable energy production. Nations with excellent solar and wind resources, stable institutions, and existing energy infrastructure may capture significant value in the post-carbon economy. This dynamic particularly applies to countries with both fossil fuel exports and renewable potential, creating complex strategic choices about energy transition timing and investment allocation.
What Oil Prices Mean for Investors
Australia occupies a unique position in global energy markets as both a significant fossil fuel exporter and a major oil importer. This dual exposure creates complex relationships between oil prices, currency movements, and investment opportunities that Investors must understand when positioning portfolios across energy cycles.
The country imports approximately 75% of its oil consumption, primarily as refined petroleum products, making Australia vulnerable to global oil price increases. Higher oil prices increase import costs, contribute to inflation, and reduce consumer spending power—typically pressuring the Australian dollar lower against major currencies. However, this relationship is complicated by Australia's position as the world's largest liquefied natural gas exporter and second-largest coal exporter.
Energy exports generate substantial foreign currency earnings that partially offset oil import costs. When oil prices rise, natural gas prices often follow, improving Australia's trade balance and supporting the Australian dollar. This creates a complex dynamic where the AUD's response to oil prices depends on the relative price movements of oil versus gas and coal, as well as global risk sentiment affecting commodity currencies generally.
| ASX Energy Stock | Primary Focus | Oil Price Sensitivity |
|---|---|---|
| Woodside Energy (WDS) | LNG, Oil & Gas | Moderate (Gas price link) |
| Santos (STO) | Gas, Oil | High (Oil revenue ~40%) |
| Beach Energy (BPT) | Oil, Gas | Very High (Oil focused) |
| Origin Energy (ORG) | Integrated Energy | Low (Downstream focus) |
ASX-listed energy companies provide direct exposure to oil and gas price movements, though with varying sensitivity levels. Woodside Energy, Australia's largest petroleum producer, generates revenue primarily from LNG exports priced on oil-linked contracts, creating indirect oil exposure with 3-6 month lags. Santos maintains more balanced oil and gas production, making it more sensitive to immediate oil price movements.
Beach Energy offers the purest oil price exposure among major ASX energy stocks, with production weighted toward crude oil rather than gas. The company's Cooper Basin operations make it particularly sensitive to oil price cycles, typically seeing share price movements that amplify underlying commodity price changes by 2-3 times.
Portfolio positioning across oil cycles requires understanding these relationships and their timing. Rising oil prices typically benefit Australian energy stocks and support commodity-sensitive sectors like mining services, while pressuring consumer discretionary companies facing higher input costs. The Australian dollar's response creates additional complexity, as currency movements affect the competitiveness of both exporters and import-competing industries.
For long-term investors, the energy transition creates both risks and opportunities within Australian markets. Traditional energy companies face potential stranding of fossil fuel assets, while renewable energy developers and critical mineral producers may benefit from decarbonisation trends. Mining companies producing lithium, rare earths, and battery metals could capture significant value as the global economy transitions away from fossil fuels.
Understanding oil market dynamics remains crucial for Investors even as the energy transition accelerates. Petroleum will continue driving economic cycles and currency movements for decades, while the transition itself creates new investment themes around energy storage, grid modernisation, and mineral resources essential for renewable technologies. Successful navigation requires balancing exposure to both traditional energy cycles and emerging transition opportunities.
Frequently Asked Questions
How do oil price changes affect my Australian investment portfolio and ASX energy stocks?
Oil price volatility directly impacts ASX-listed energy companies like Woodside Energy and Santos, affecting their share prices and dividend yields. Higher oil prices typically boost Australian energy stocks but can increase inflation, prompting RBA interest rate adjustments. Diversified portfolios should consider oil exposure through energy ETFs or direct energy stock investments for inflation hedging.
What are the main oil market benchmarks Australian investors should track for investment decisions?
Australian investors primarily monitor WTI (West Texas Intermediate) and Brent crude benchmarks, as these influence local energy company valuations on the ASX. Brent typically affects Australian oil producers more directly due to export markets. Track these prices through ASX market data or financial platforms to inform energy sector investment timing and portfolio allocation decisions.
How does OPEC influence Australian energy investments and what risks should I consider?
OPEC production decisions create oil price volatility that significantly impacts Australian energy stocks and broader market sentiment. Supply cuts boost prices, benefiting ASX energy companies but raising inflation concerns for the RBA. Key risks include geopolitical tensions, production quota changes, and supply disruptions affecting your energy sector investments and overall portfolio performance.
Are there tax implications for investing in oil-related assets through Australian brokers and platforms?
Oil investments through ASX energy stocks, ETFs, or oil futures are subject to standard capital gains tax rules. The ATO treats energy sector dividends as assessable income, while capital gains may qualify for 50% discount if held over 12 months. Ensure ASIC-regulated platforms are used and maintain detailed records for tax reporting purposes.
Recommended Reading


Key Statistics
Daily Production
World produces approximately 100 million barrels of oil per day as of 2024
OPEC Founded
September 1960 in Baghdad — Venezuela, Saudi Arabia, Iraq, Iran, Kuwait as founding members
1973 Oil Shock
Arab oil embargo October 1973 — oil price quadrupled from $3 to $12 per barrel in weeks
Brent vs WTI
Two main global benchmarks — Brent (North Sea, global reference) and WTI (West Texas Intermediate, US reference)
Petrodollar System
Since 1974 Nixon-Kissinger deal, all OPEC oil priced in USD — creating permanent global dollar demand
Peak Oil Debate
US shale revolution 2008–2015 disproved conventional peak oil theory — US became world's largest producer by 2018